本文介绍 golang 如何做性能分析。
对服务做了基准性能测试后,如果服务出现问题,可以通过性能分析工具,查出消耗资源的瓶颈,并做针对性的性能优化。
Golang 语言也为我们提供了方便的性能分析工具pprof,方便我们做必要的服务优化。pprof 可以做cpu分析,统计所有调用方法执行的时间片(通过采样); 可以查看内存分配,找到是否有内存泄漏,哪里泄露了(调用栈);还可以查看Block、事件调用,互斥锁等。可谓麻雀虽小,五脏俱全。Golang 提供了两种分析的工具,一种是web工具,直接引入即可;另一种是命令行交互工具,需要抓取prof 数据,再做详细分析。
WEB 工具
golang 性能分析工具主要有几种,最常用的是使用web 界面的工具。我们举个简单的例子,将一个map数据做编码,编码100w次,例子如下:
 1
 2
 3
 4
 5
 6
 7
 8
 9
10
11
12
13
14
15
16
17
18
19
20
21
22
23
24
25
26
27
28
package main
import "encoding/json"
import _ "net/http/pprof"
import "net/http"
func main () {
mapData :=
mapData := map [ string ] string {
"abcdefg1" : "aaaaaaaaaaaaaaaaaaaa" ,
"abcdefg2" : "aaaaaaaaaaaaaaaaaaaa" ,
"abcdefg3" : "aaaaaaaaaaaaaaaaaaaa" ,
"abcdefg4" : "aaaaaaaaaaaaaaaaaaaa" ,
"abcdefg5" : "aaaaaaaaaaaaaaaaaaaa" ,
"abcdefg6" : "aaaaaaaaaaaaaaaaaaaa" ,
"abcdefg7" : "aaaaaaaaaaaaaaaaaaaa" ,
"abcdefg8" : "aaaaaaaaaaaaaaaaaaaa" ,
"abcdefg9" : "aaaaaaaaaaaaaaaaaaaa" ,
"abcdefg10" : "aaaaaaaaaaaaaaaaaaaa" ,
}
go func () {
for i := 0 ; i < 100000000 ; i ++ {
_ , _ = json . Marshal ( data )
}
}()
http . ListenAndServe ( "0.0.0.0:8080" , nil )
}
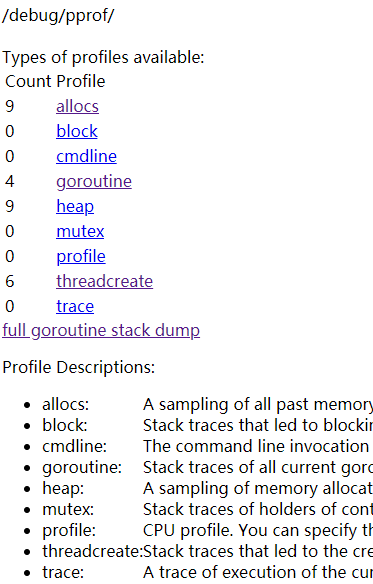
引入 “net/http/pprof” 包,将自动在默认的http中添加相关 pprof 的处理方法(当然也可以自己添加了)。
我们通过访问 /debug/pprof/ 就可以打开对应的web 界面。
allocs 过去所有内存分配的采样。block 查看阻塞同步的堆栈cmdline 当前进程的命令行goroutine 所有协程的调用栈heap 当前活动对象的内存分配mutex 竞态互斥锁的调用栈profile 获取一个30s(可以通过seconds 参数指定)的cpu 采样prof 文件 (可以用 go tool pprof 分析)threadcreate 导致创建了新系统线程的调用栈trace 抓一个当前执行的trace包,可以捕获各种事件(可以用go tool trace 做可视化分析)命令行交互
命令行工具,需要先抓取一段采样数据,采样数据可以通过web 的 profile 链接直接下载,也可以不启动web服务,直接采样。直接采样的好处是,可以直接采样我们需要优化的代码段的数据,而web采样的数据不一定会抓到我们执行的代码段(毕竟是通过采样实现的)。下面我们写一个直接采样的例子:
 1
 2
 3
 4
 5
 6
 7
 8
 9
10
11
12
13
14
15
16
17
18
19
20
21
22
23
24
25
26
27
28
29
30
31
32
33
34
35
36
package main
import "encoding/json"
import "runtime/pprof"
import "os"
import "log"
func main () {
cpuprofile := "json_map.prof"
mapData := map [ string ] string {
"abcdefg1" : "aaaaaaaaaaaaaaaaaaaa" ,
"abcdefg2" : "aaaaaaaaaaaaaaaaaaaa" ,
"abcdefg3" : "aaaaaaaaaaaaaaaaaaaa" ,
"abcdefg4" : "aaaaaaaaaaaaaaaaaaaa" ,
"abcdefg5" : "aaaaaaaaaaaaaaaaaaaa" ,
"abcdefg6" : "aaaaaaaaaaaaaaaaaaaa" ,
"abcdefg7" : "aaaaaaaaaaaaaaaaaaaa" ,
"abcdefg8" : "aaaaaaaaaaaaaaaaaaaa" ,
"abcdefg9" : "aaaaaaaaaaaaaaaaaaaa" ,
"abcdefg10" : "aaaaaaaaaaaaaaaaaaaa" ,
}
if cpuprofile != "" {
f , err := os . Create ( cpuprofile )
if err != nil {
log . Fatal ( err )
}
pprof . StartCPUProfile ( f )
defer pprof . StopCPUProfile ()
}
for i := 0 ; i < 1000000 ; i ++ {
_ , _ = json . Marshal ( mapData )
}
}
然后我们通过如下命令进入交互模式:
1
2
3
4
5
6
7
[ root @ localhost pprof ] # go tool pprof json_map.prof
File : json_map_1
Type : cpu
Time : Apr 11 , 2020 at 6 : 49 pm ( CST )
Duration : 7.38 s , Total samples = 7.12 s ( 96.46 % )
Entering interactive mode ( type "help" for commands , "o" for options )
( pprof )
交互模式,也提供了丰富的命令查看prof文件中的数据,例如如下使用top10 查看代码执行cpu占比top10 的方法。
 1
 2
 3
 4
 5
 6
 7
 8
 9
10
11
12
13
14
15
(pprof) top10
Showing nodes accounting for 3470ms, 48.74% of 7120ms total
Dropped 78 nodes (cum <= 35.60ms)
Showing top 10 nodes out of 87
      flat  flat%   sum%        cum   cum%
     570ms  8.01%  8.01%     1100ms 15.45%  encoding/json.(*encodeState).string
     550ms  7.72% 15.73%     1850ms 25.98%  runtime.mallocgc
     460ms  6.46% 22.19%      460ms  6.46%  runtime.memmove
     410ms  5.76% 27.95%      540ms  7.58%  runtime.mapaccess2
     320ms  4.49% 32.44%      350ms  4.92%  runtime.heapBitsSetType
     290ms  4.07% 36.52%      970ms 13.62%  runtime.typedmemmove
     230ms  3.23% 39.75%      230ms  3.23%  runtime.nextFreeFast
     220ms  3.09% 42.84%      220ms  3.09%  runtime.memclrNoHeapPointers
     210ms  2.95% 45.79%      210ms  2.95%  cmpbody
     210ms  2.95% 48.74%     6720ms 94.38%  encoding/json.mapEncoder.encode
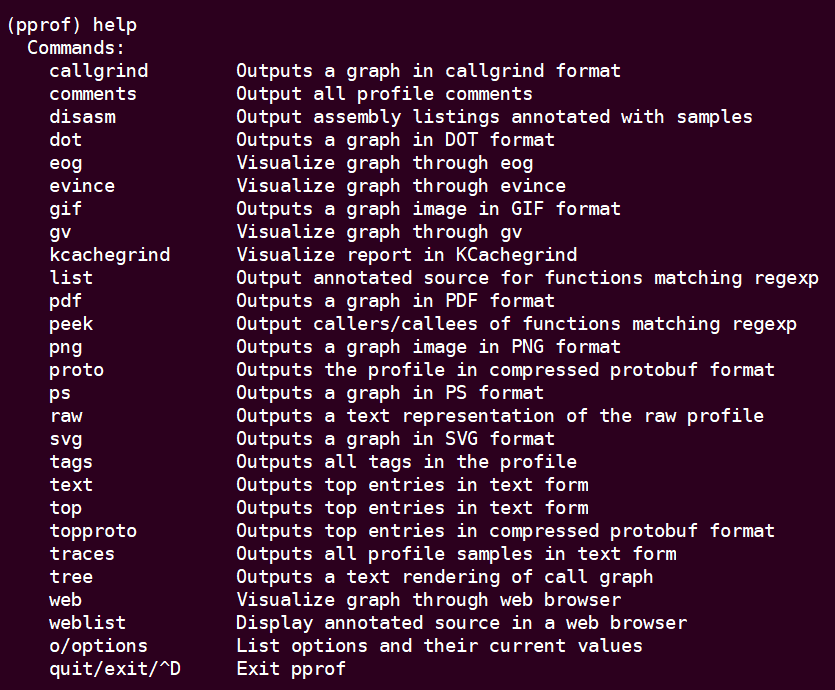
还有其他功能,例如绘制调用图,内存分配图等,可以通过help查看:
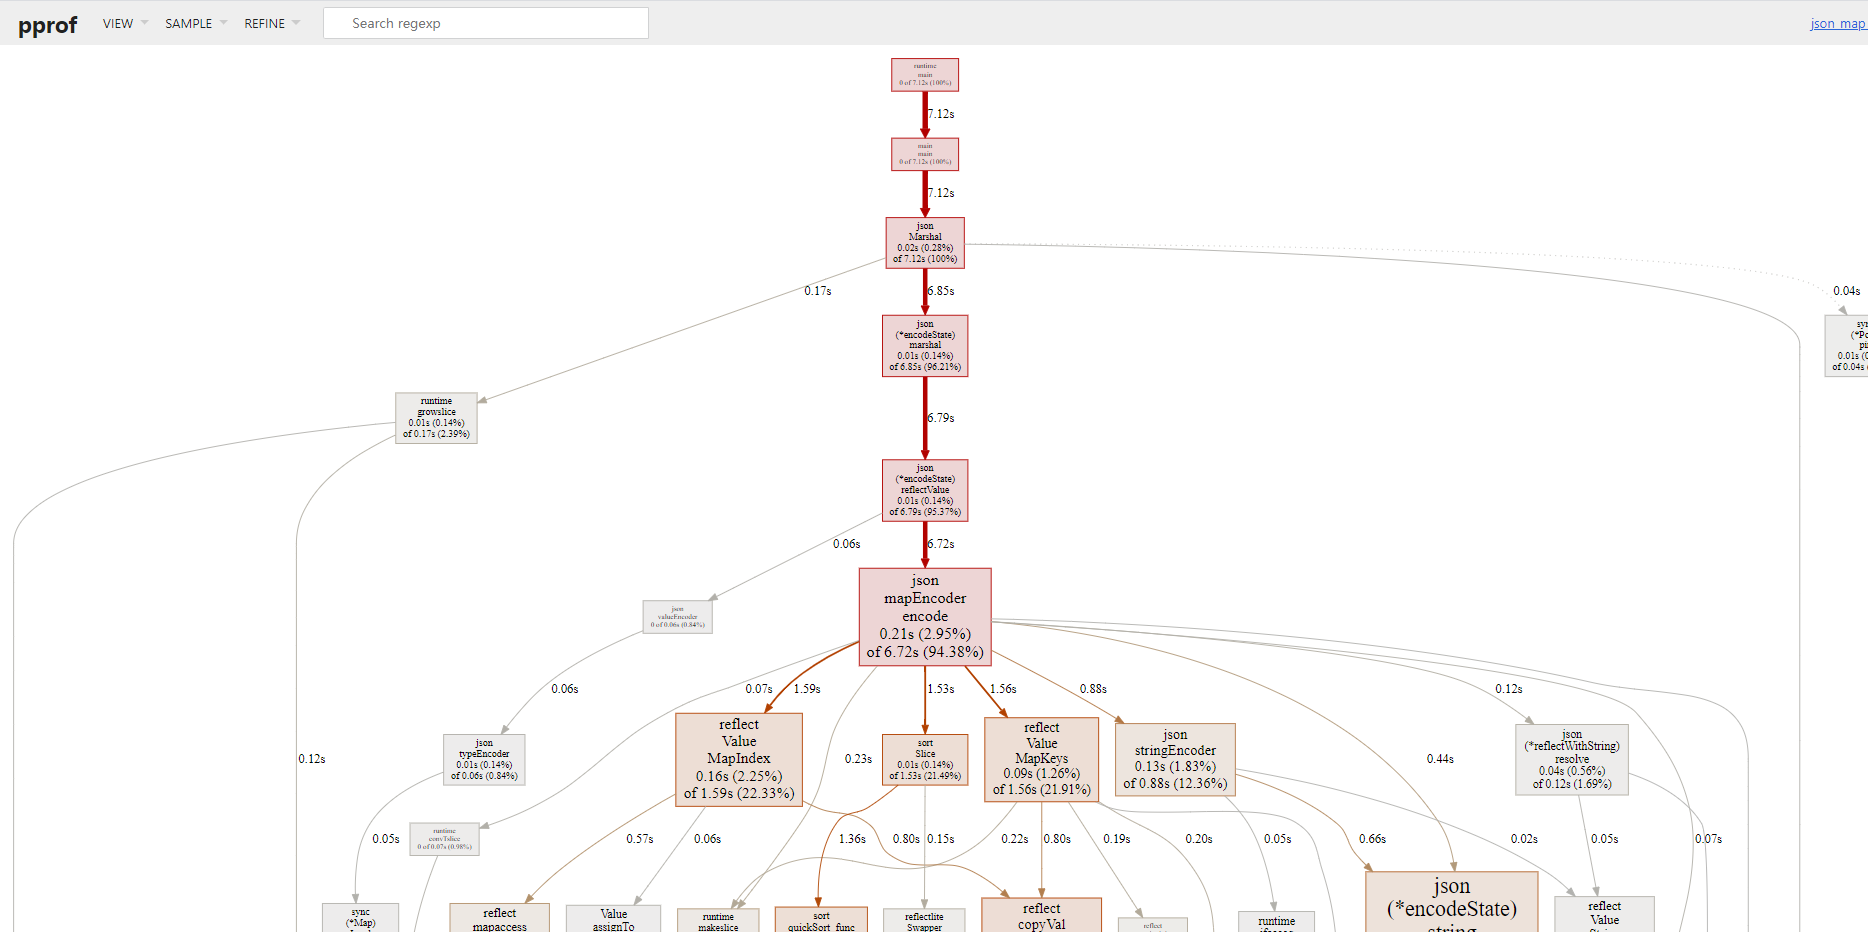
除此之外,go tool profile 还有另外的打开模式。例如,通过web服务查看prof 文件。
执行如下命令,通过web服务查看prof文件:
1
[ root @ localhost pprof ] # go tool pprof -http=:8080 json_map.prof
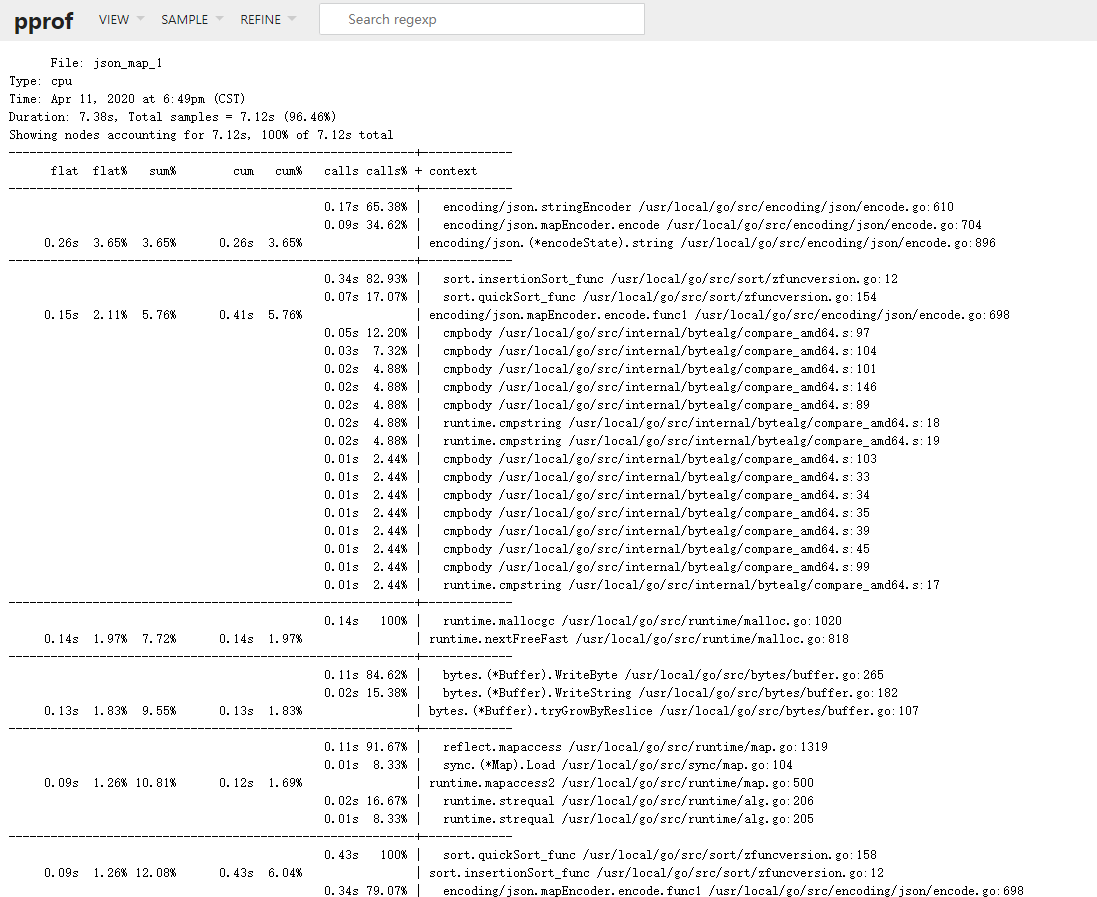
可以查看进程调用图,看到各调用函数的执行事件。
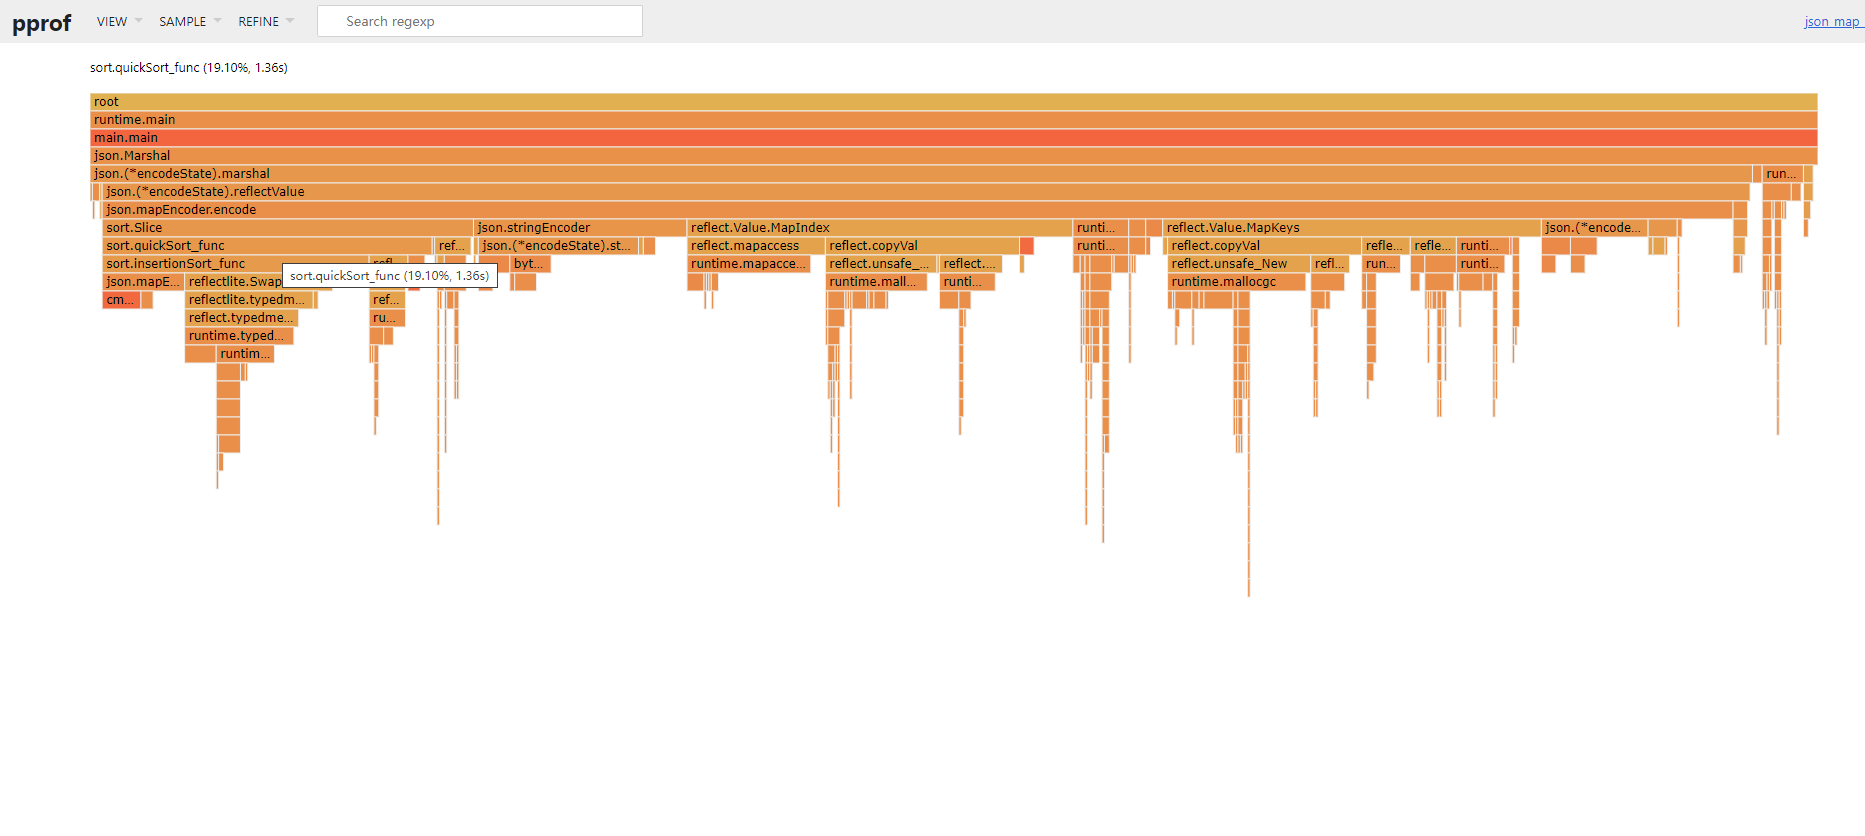
可以查看火焰图,具体分析哪些方法有优化空间。
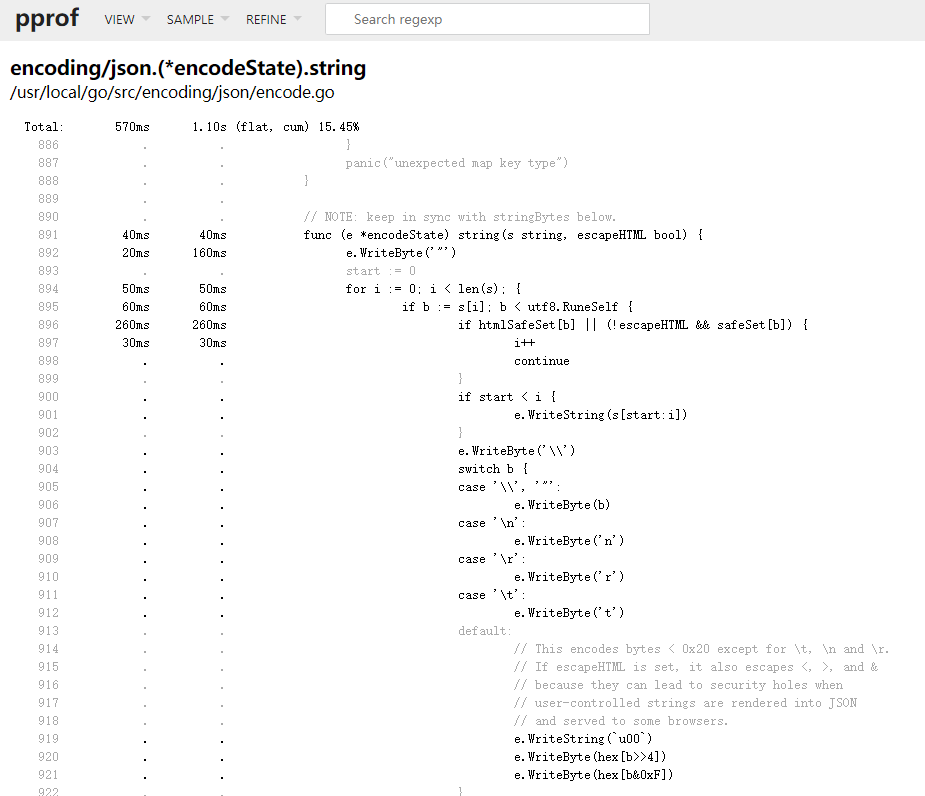
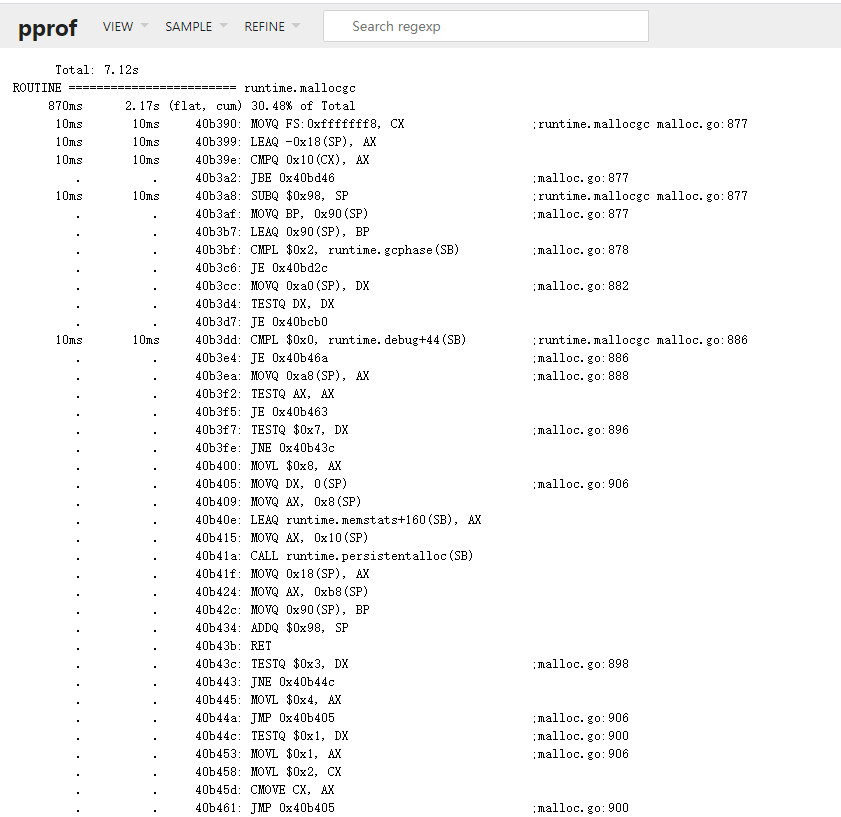
也可以通过反汇编的代码角度查看执行时间占比。
除此之外,还可以命令行方式直接抓取web工具中的profile 数据做分析。(实际看来和自己抓取没什么区别,只是方便了而已)
其他
golang 目前提供的性能分析工具已经比较齐全了。本文只是对目前已经使用的功能做简单总结,其他功能还待我们一起去探索。
备注:
本文使用的go版本为1.13
下一篇将对 go tool 的另一神器 go tool trace 做简单总结。